The Greek Startup Compensation Report 2022

The Greek startup industry continues to grow. Every year we see more founders starting up, companies expanding their operations, and an increasing amount of talent joining the industry. Today we are excited to release our second compensation report, taking our efforts to the next level.
To our knowledge, this report is the only free resource in Greece that provides in-depth compensation and benefits information for companies and professionals in the technology industry. The survey reports the 10th, 50th (median), and 90th compensation percentiles by level or job title and technology.
Background & Reporting
Last year our 2021 Greek Startup Compensation Report was very well received. Its success led us to expand the report this year to include non-technical roles. 40 tech companies participated (up from 27 last year) across different funding stages and sizes. The participating companies were asked to provide detailed compensation data on each role based in Greece and align the role with a job family (department), job title, track, level, and years of experience to ensure consistency across seniority levels and roles. In addition, all companies provided demographic information (gender, age range, location) and details on benefits provided by the company. Data from over 3,000 employees were gathered with more than 35,000 data points.
Below, you can find a list of the participating companies:
Job Families
The following Job Families were reported on:
Administration
Marketing (incl. Communication)
Data
Design
Engineering
Finance
Human Resources
Legal
Product
Sales
Support
Leveling & Job Titles
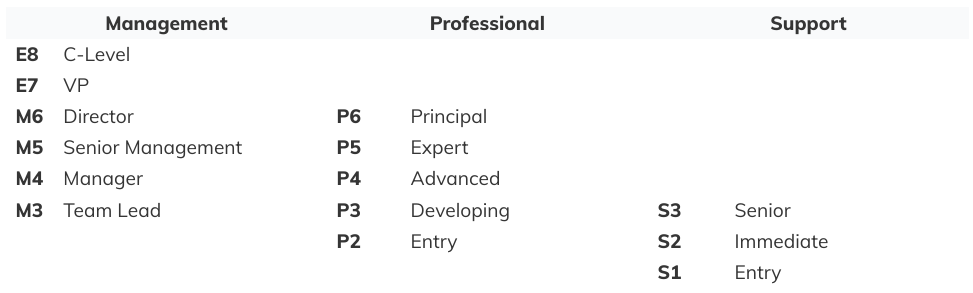
We created a leveling system (see table below) to ensure as much uniformity across levels as possible. Each level has a clear definition outlined, as you can see in this overview. The overview also outlines the job titles per level. During data cleaning and analysis, some roles were re-leveled to fit the experience curve of the overall data properly. Extreme outliers were removed from the data to ensure compensation bands were not excessively large. In addition, not all roles can be reported on due to insufficient data points.
Compensation
Our 2022 Greek Startup Compensation Report is an informative look into the salaries of Greek Startup employees. This year, we've gone above and beyond to present our findings by creating a dashboard to help you find the compensation for each department by level or role.
The Dashboard reports on the 10th, 50th (median), and 90th percentiles per level or job title and technology for engineering roles. Like last year, we decided to report on the 10th and 90th percentiles to exclude any outliers. This ensures a more realistic and accurate picture of the results. In addition, we reported on levels, job titles, and technologies with at least four employee records or more.
The compensation is reported as the gross annual amount in euros (14 salaries plus bonus, if applicable). If you would like to get a better understanding of the net salary or total cost to the company, you can use a tool such as Mikta Kathara.
Tech compensation - compared to last year
Our latest report shows that salaries for tech roles (Engineering, Data, Product), generally, have shifted very little since last year. The most drastic changes we found were:
Significant increases (€3k - €10k) for the individual contributor DevOps roles (P3, P4, P5). This seems to relate to the overall global demand in DevOps roles, while the supply is low.
Slight increases (€1.5k - €2k) for the individual contributor Machine Learning roles (P3, P4), similar to the DevOps is currently a high in-demand role.
QA entry-level (P2) increase (€3k) and Manager (M4) increase (€4k).
It is important to note that we cannot make a 1-1 comparison with last year's results, as this year, we have added additional levels to create more granularity. In addition, the updated list of participating companies may provide some sampling bias on such comparisons.
Compensation Dashboard
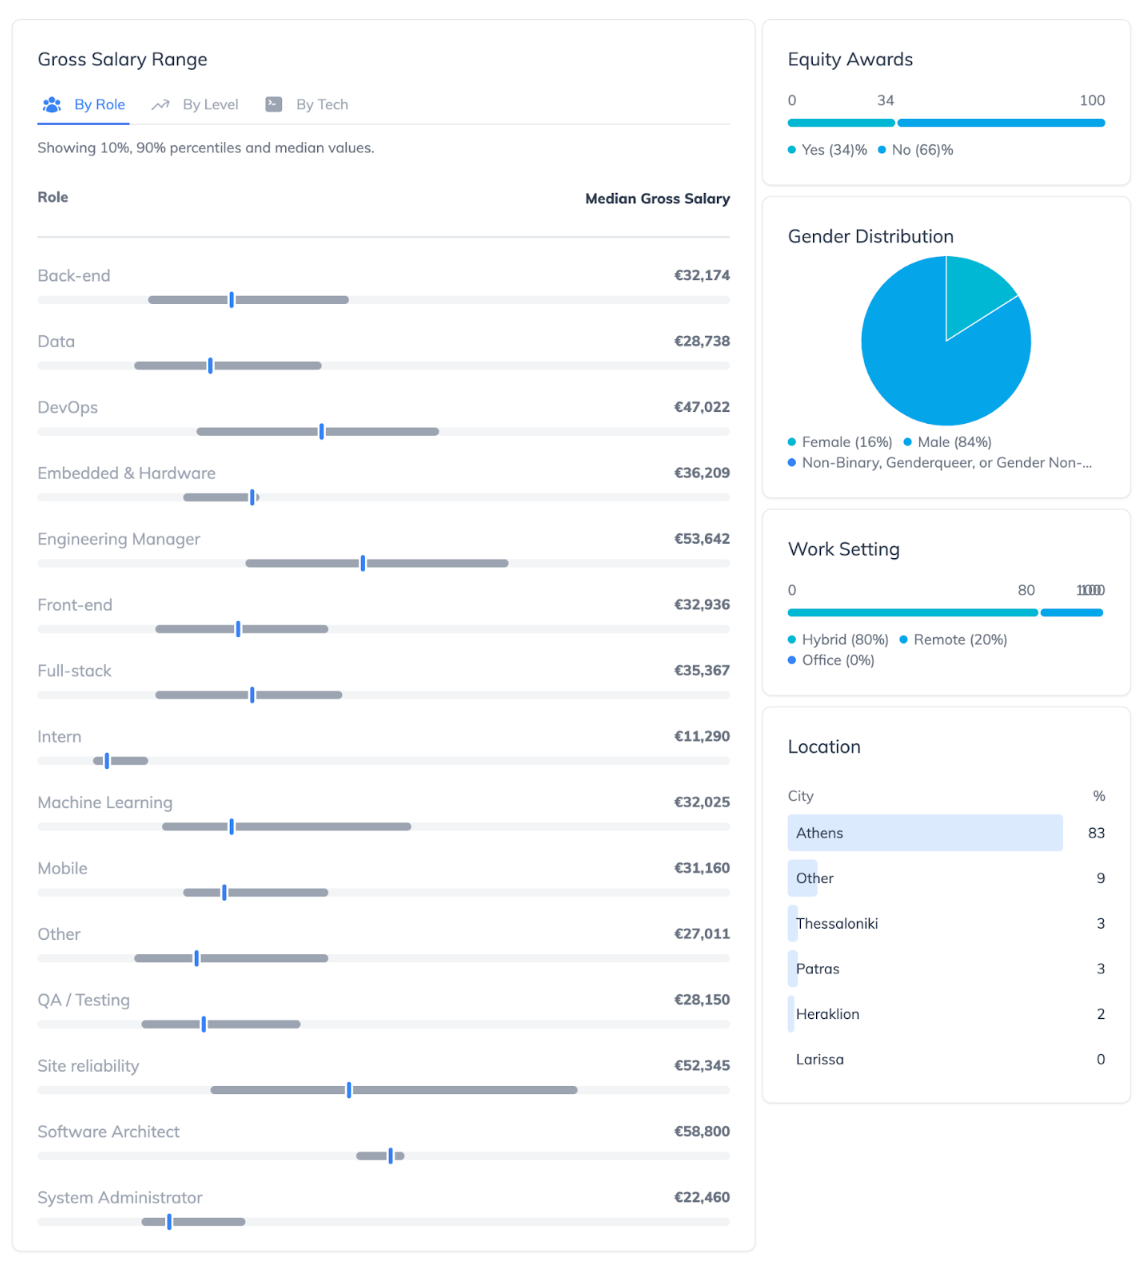
This year we created a dashboard to provide an accessible overview of the compensation for each Department by level, role, or technology (engineering only). In addition, the tool also shows equity, gender, work setting, and location distribution. Head on over to our 2022 compensation dashboard to have a look.
Equity
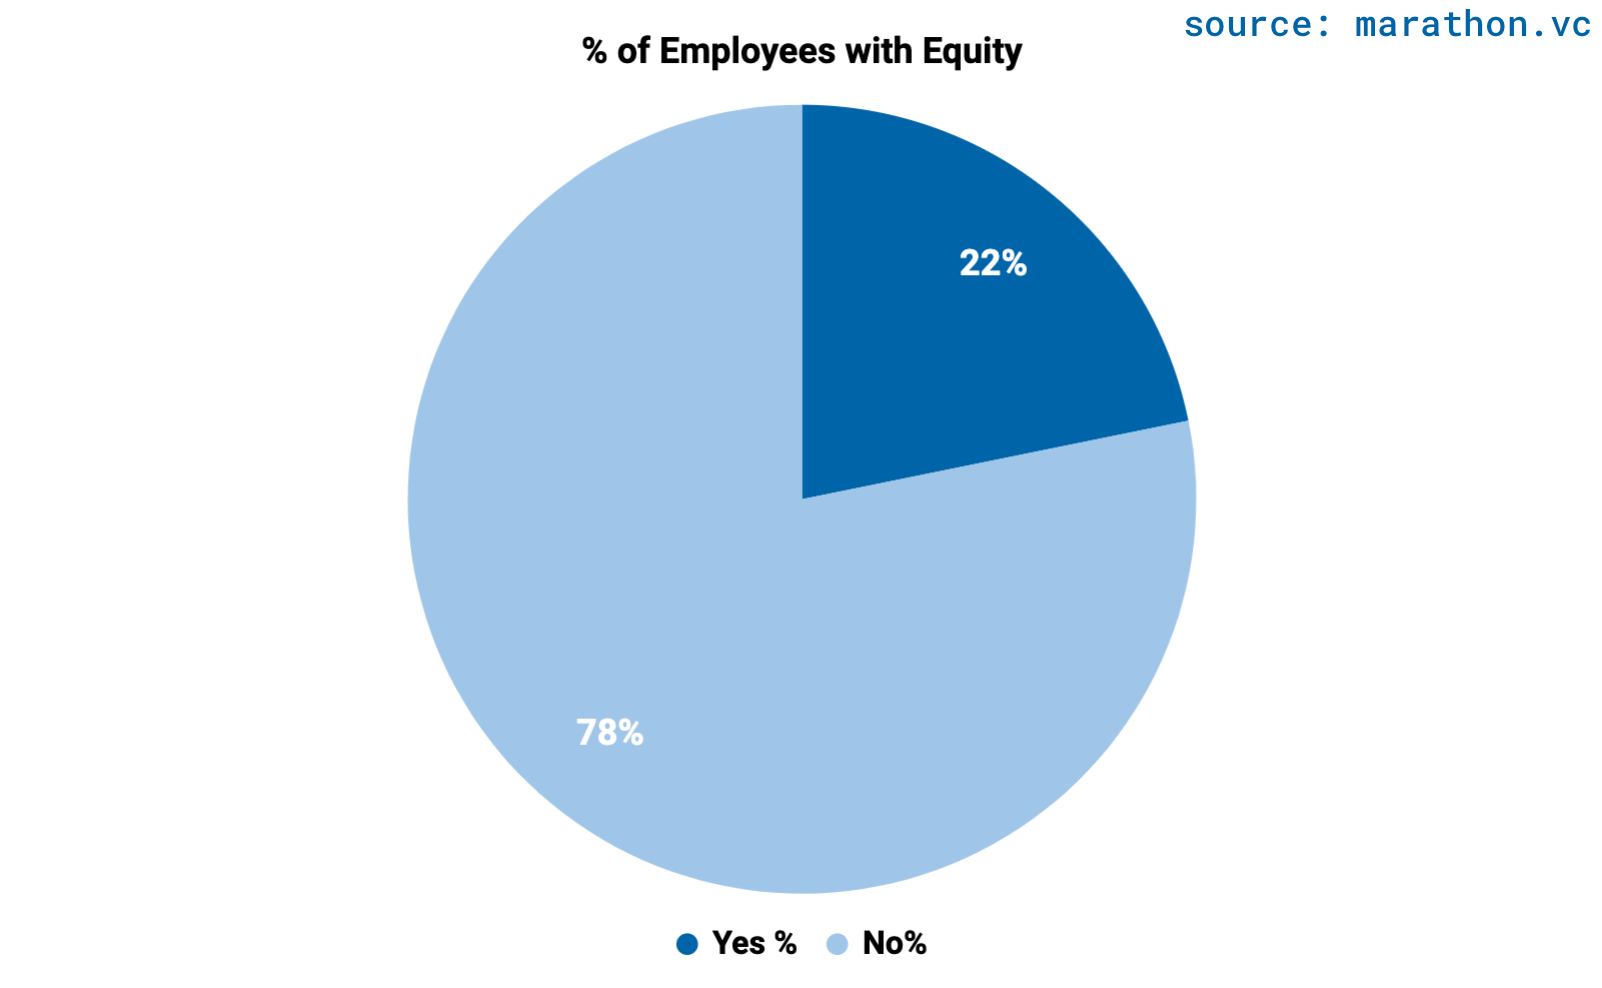
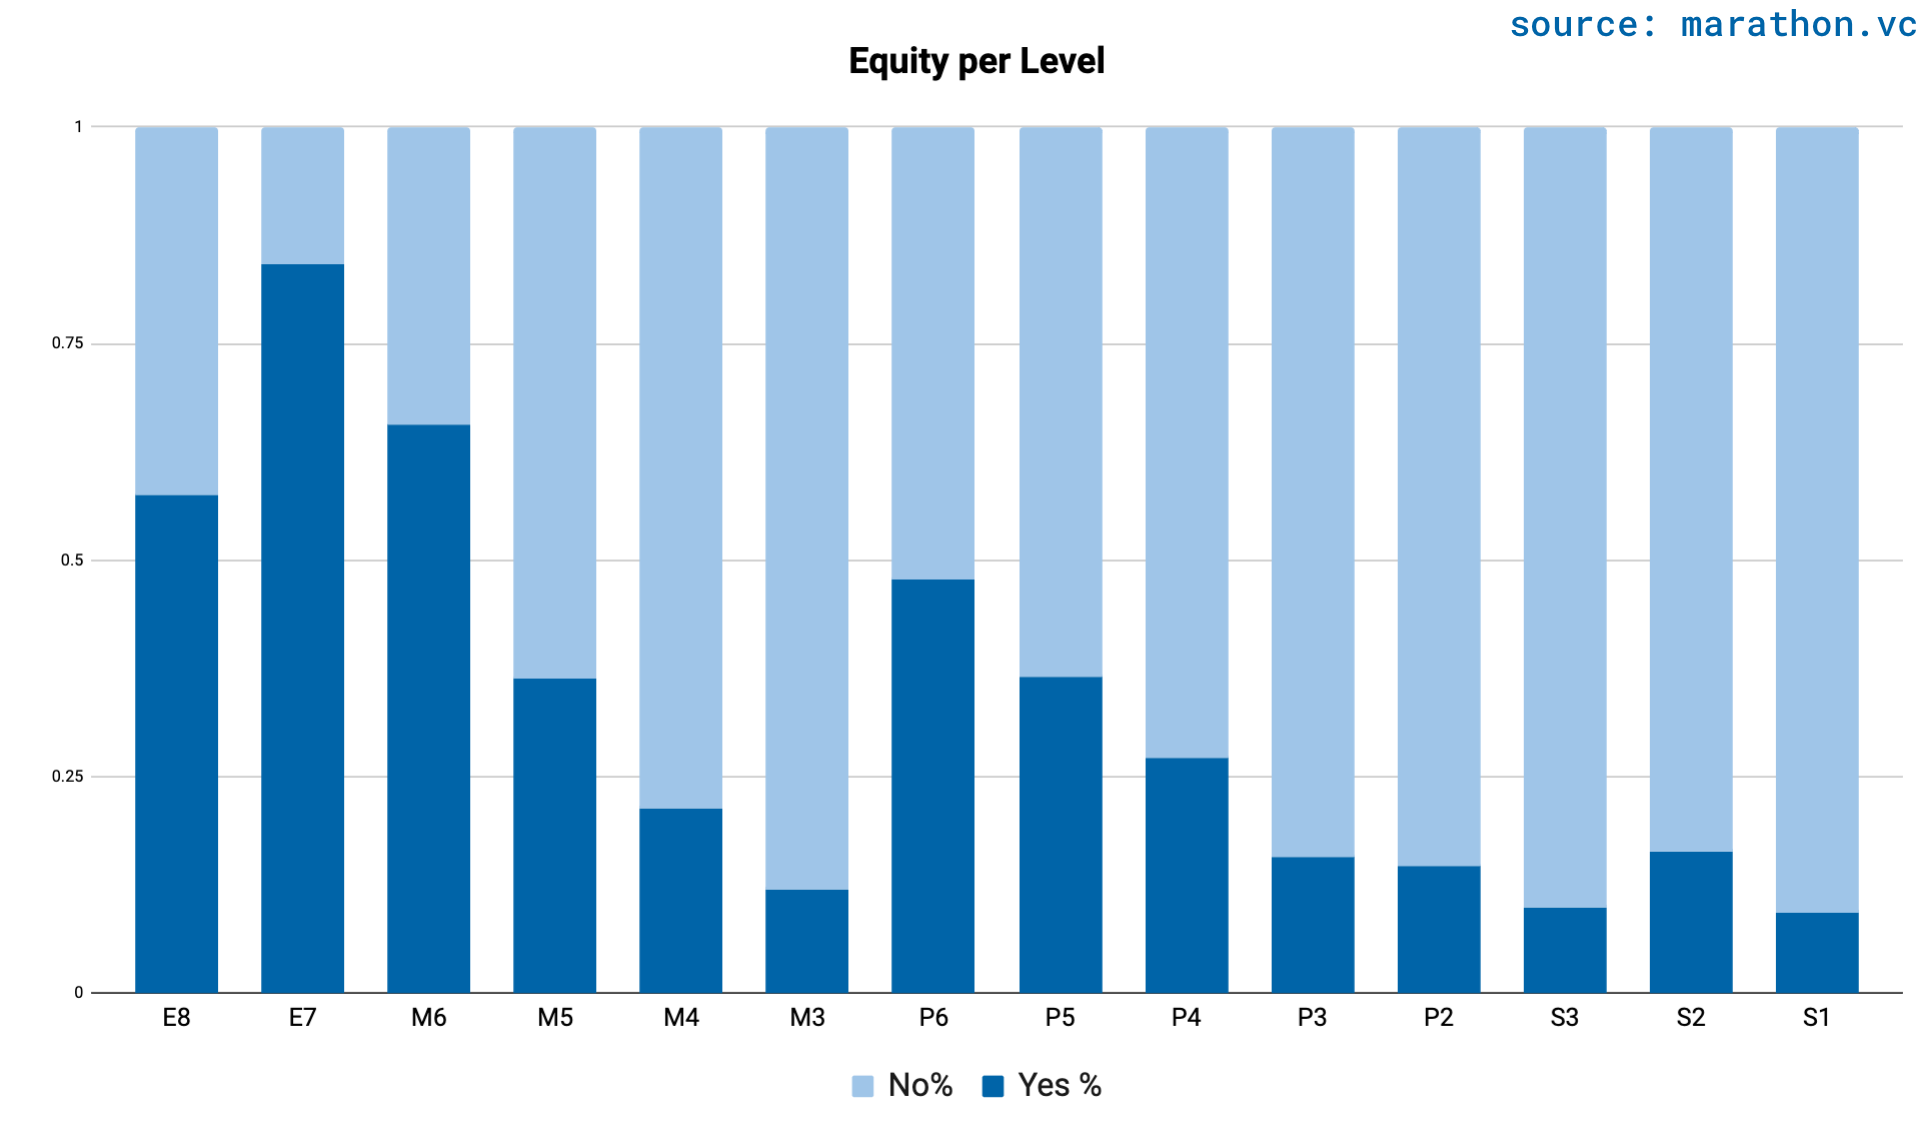
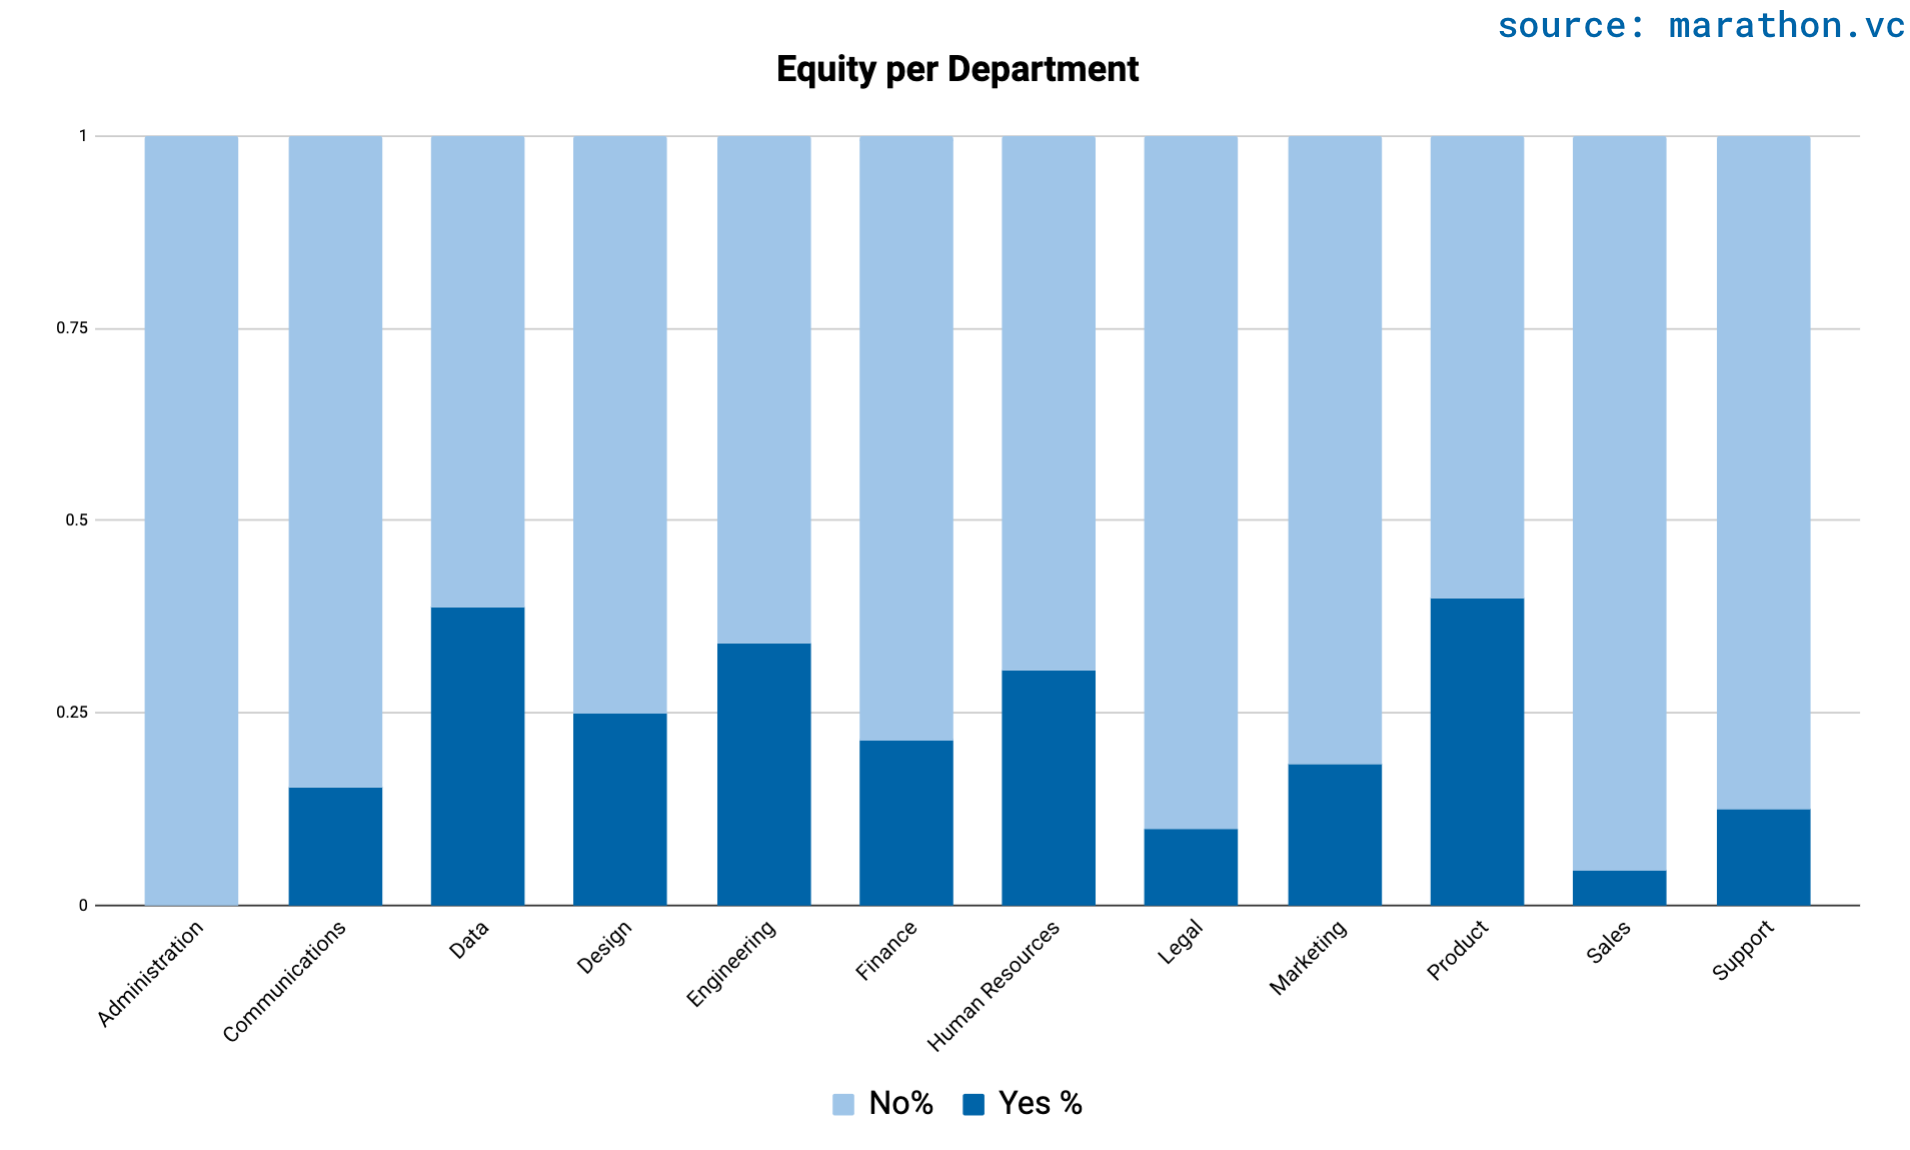
Currently, 22% of employees receive equity as part of their compensation package. The Engineering, Product, and Data departments have the larger share of employees receiving equity, between 30% and 40%. Compared to last year’s survey, equity in the Engineering department has slightly decreased from 39% to 35%. This is likely due to a sampling bias.
Furthermore, most (69%) leadership roles (Director, VP, C-Level) receive equity. For more information on Equity, check out our Employee Options vs RSU’s post.
Work Setting
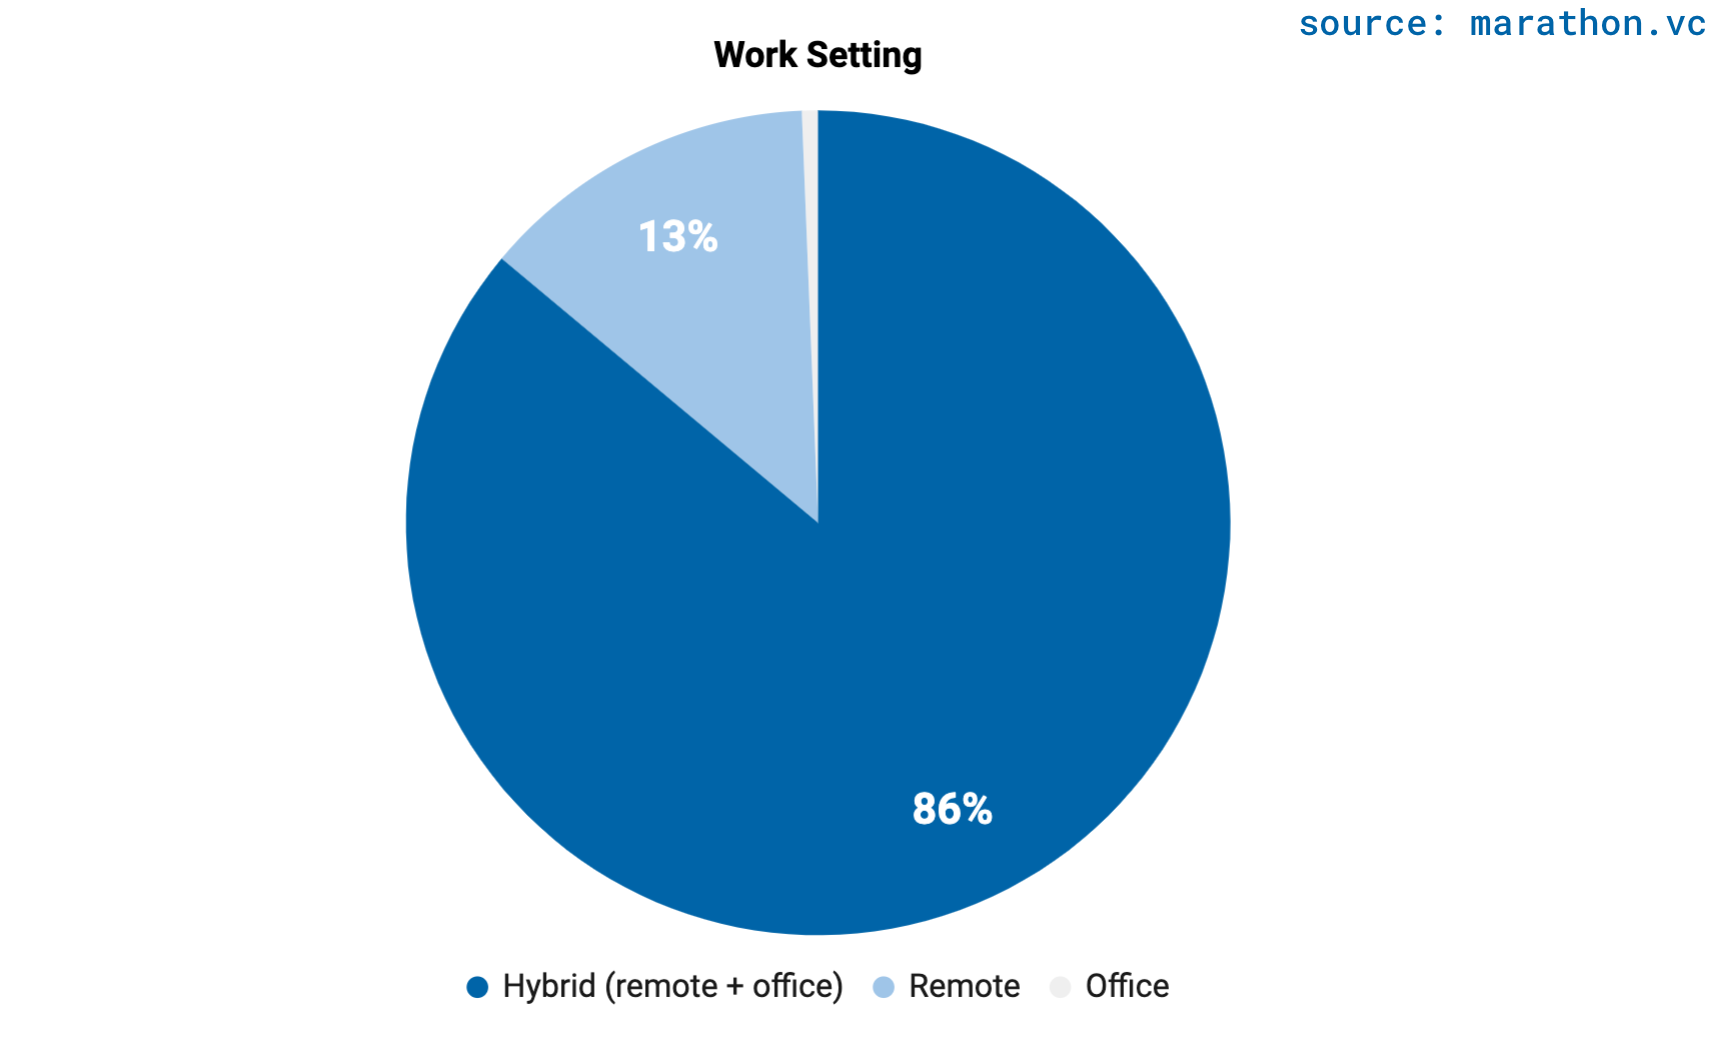
99% of roles are either remote (13%) or hybrid (86%). Most companies offer a hybrid working model (86%), while the 1% recorded office jobs are mostly related to an “office manager” or administrative role. This certainly makes tech companies attractive employers. At the same time, it should be noted that hybrid can mean anything from 1 to 4 days per week in the office.
Gender
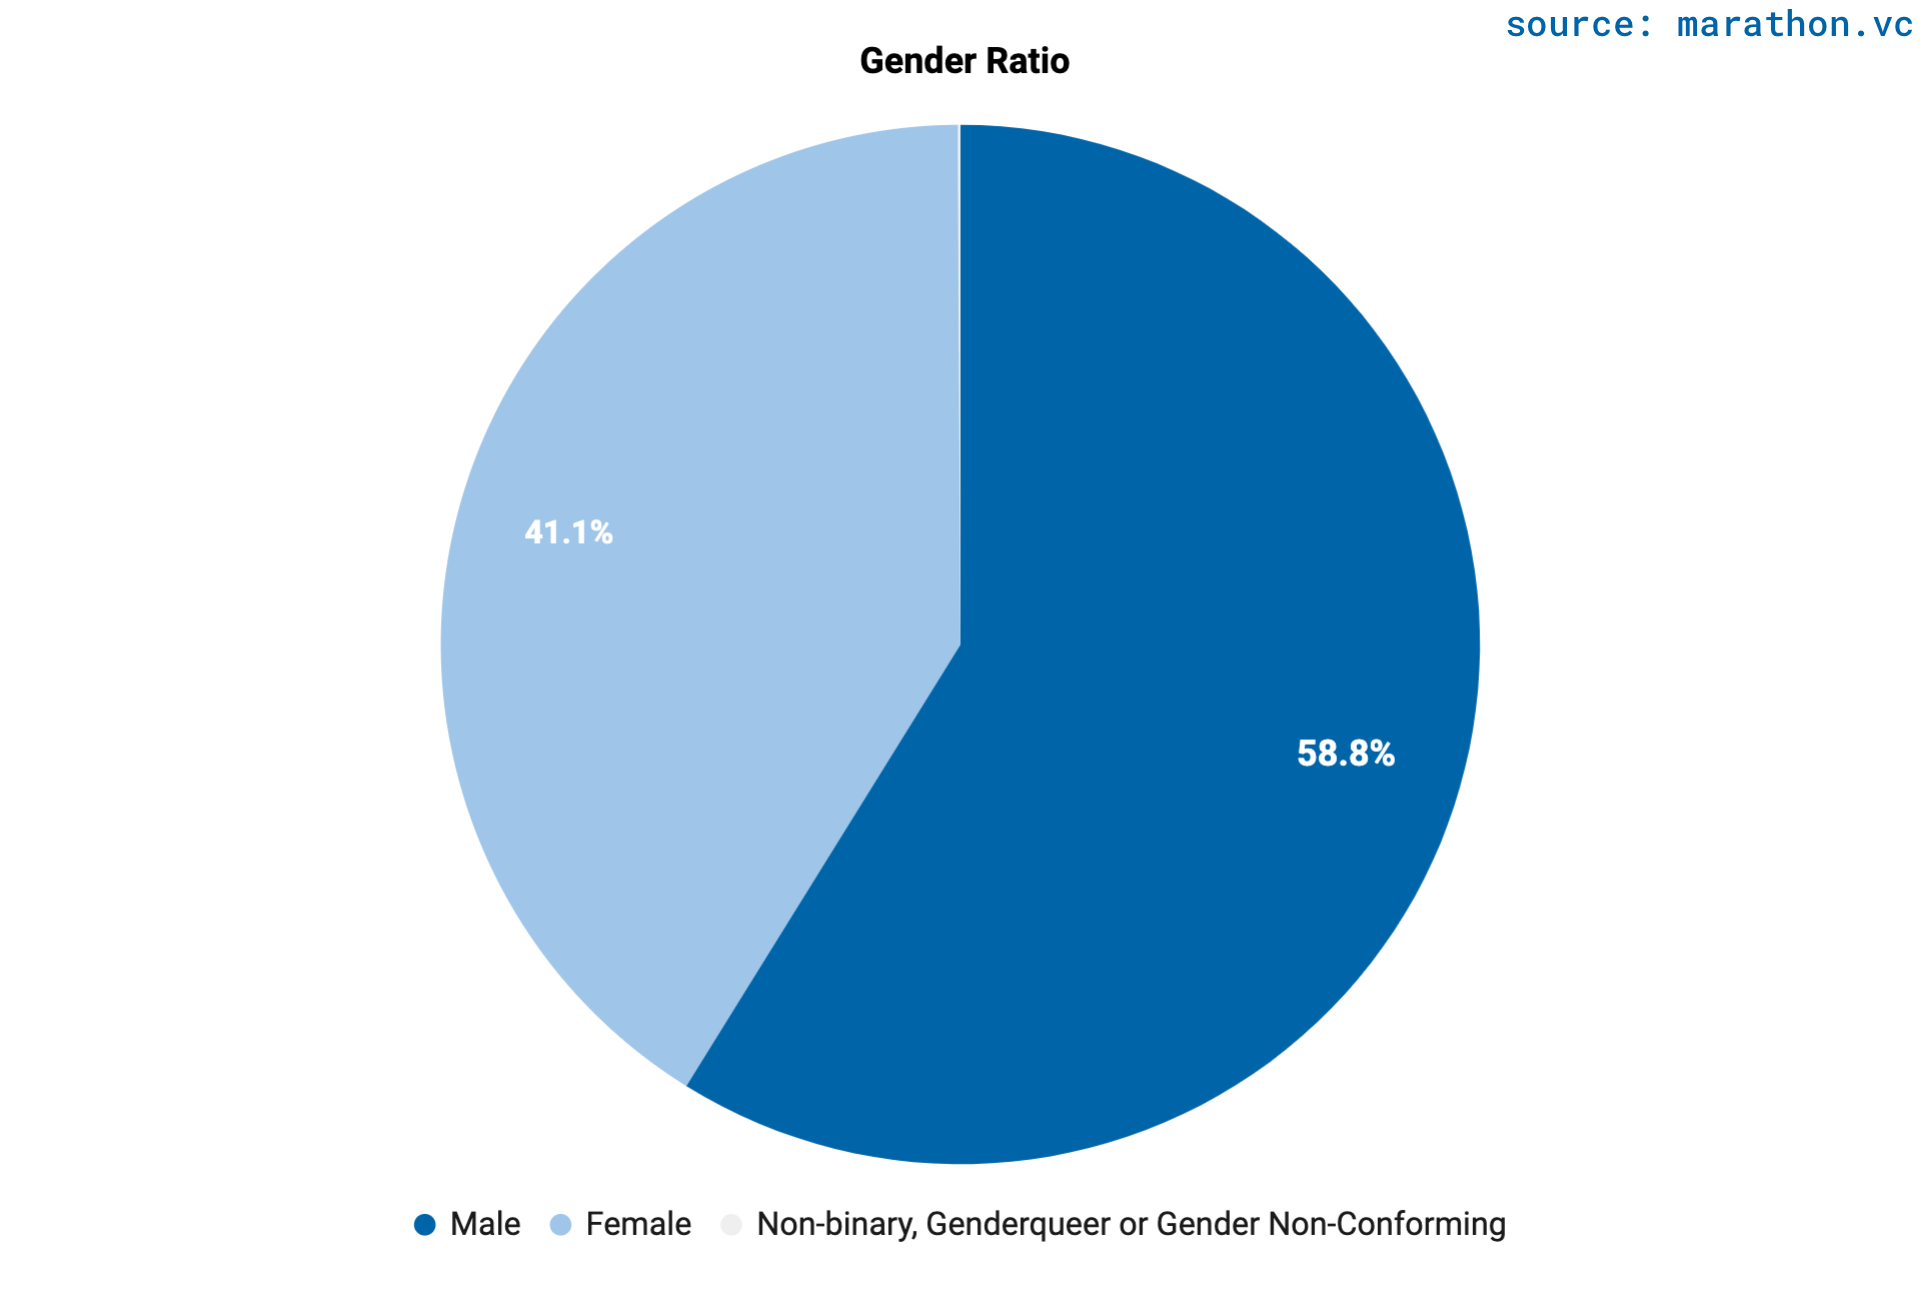
Of the data collected, over 33% of the roles were tech roles (Engineering, Data, Product). Currently, these departments are still heavily dominated by the male gender, as shown in the graph (gender ratio per department).
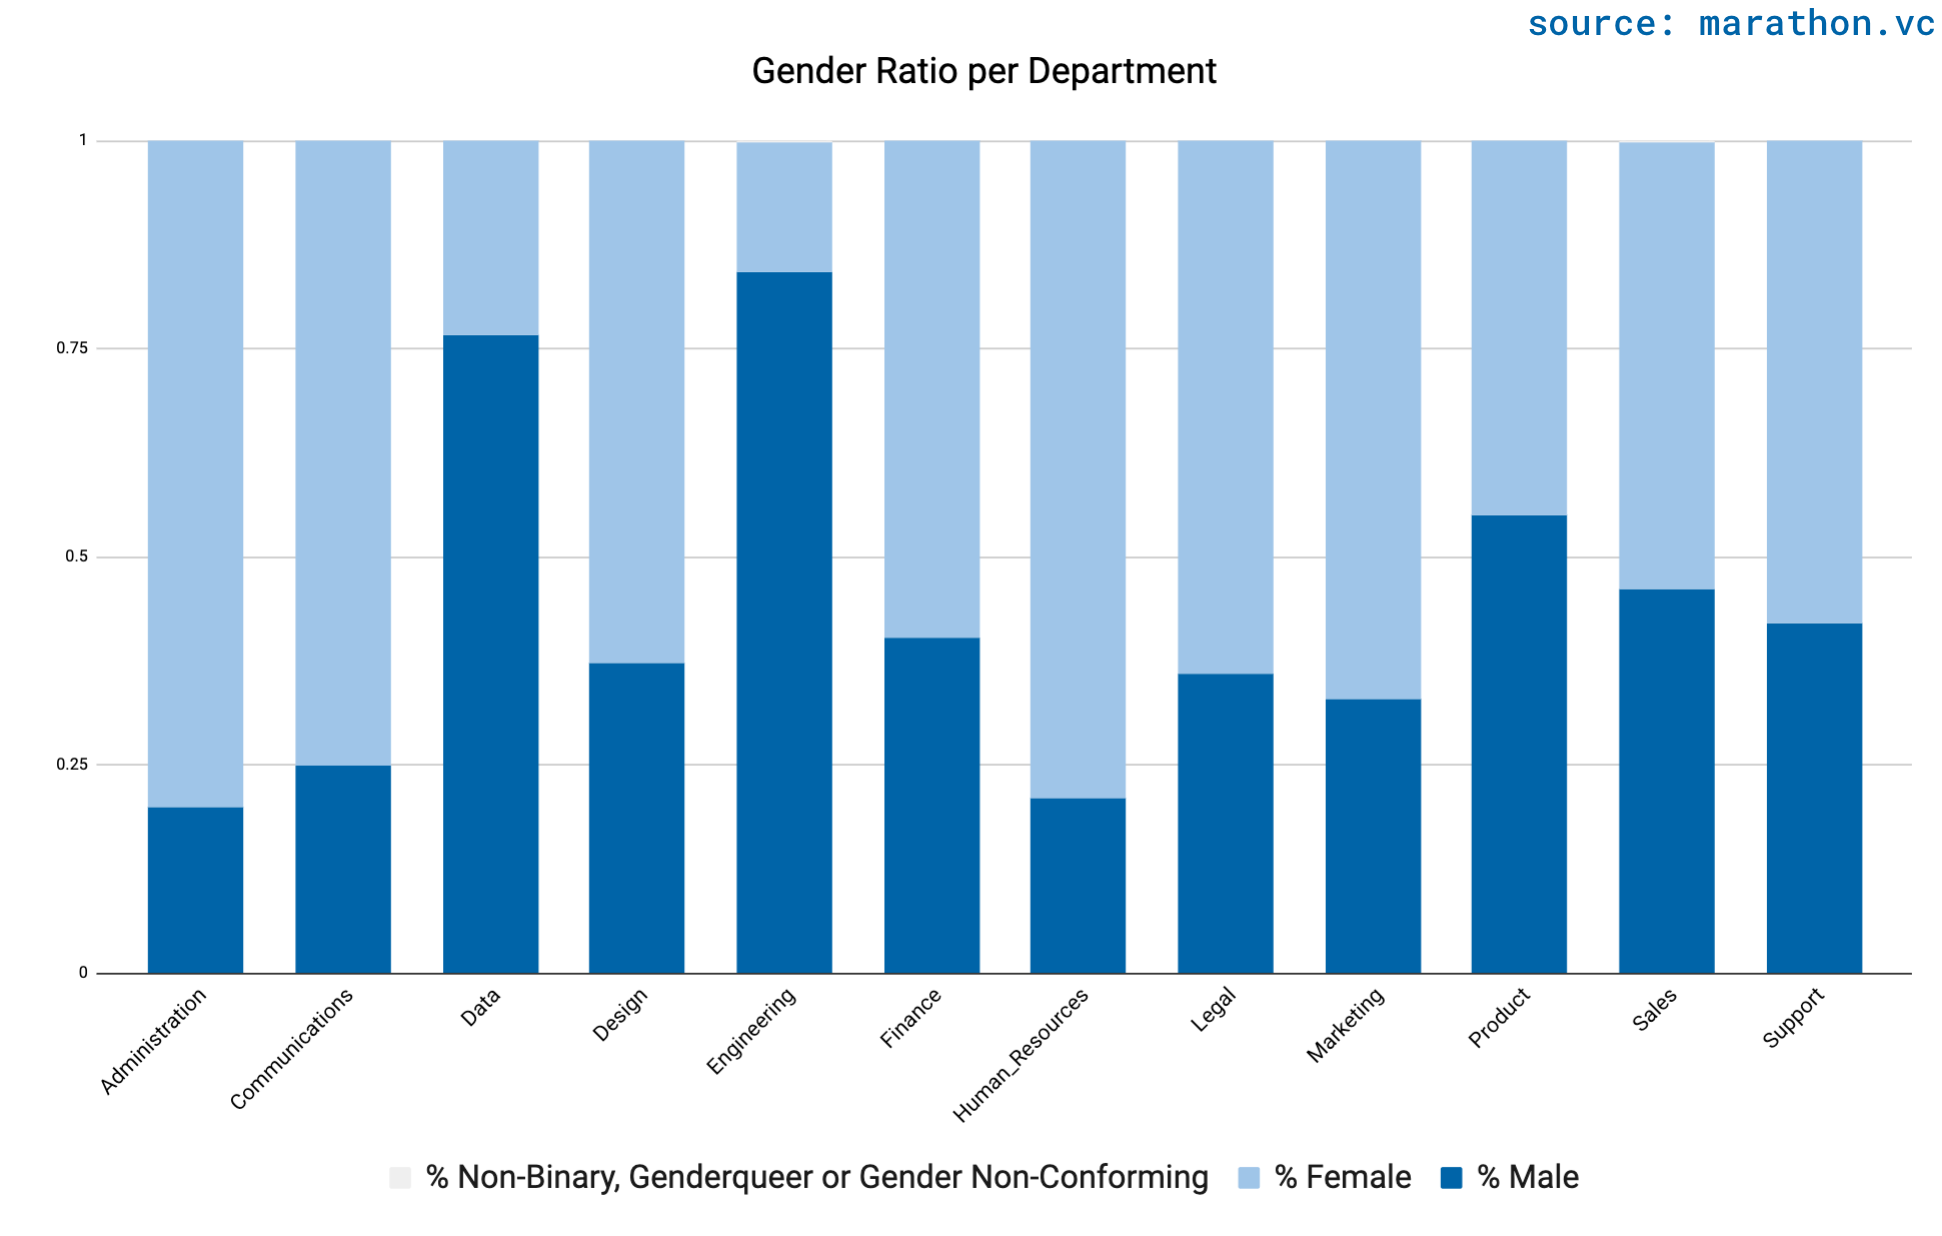
It is, therefore, no surprise that overall the percentage of males is greater (58,8%) than the percentage of females (41,1%). What is new is that we are starting to see companies in Greece report on non-binary, genderqueer, and non-conforming genders (0,1%).
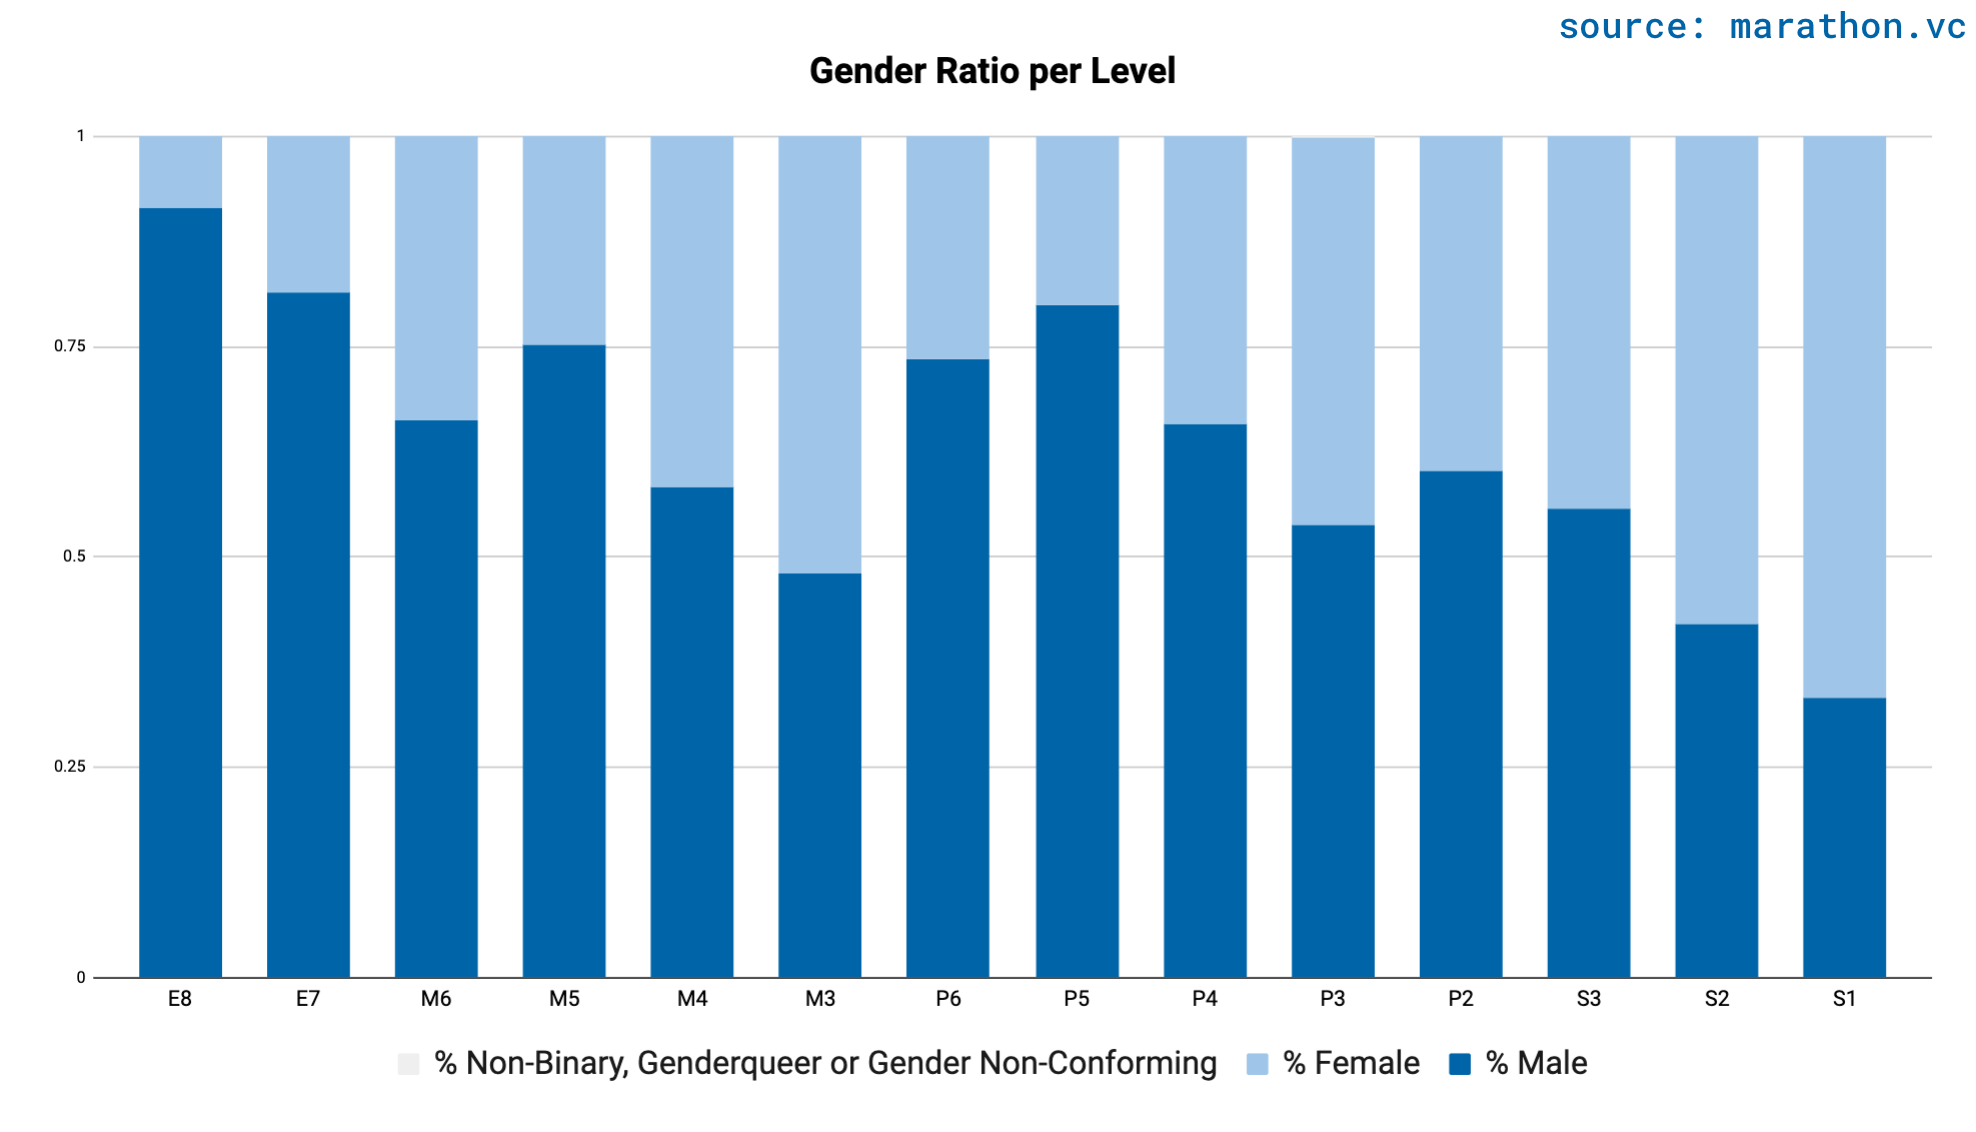
At the same time and similarly to last year’s report, we still see a very low percentage of females (compared to males) in leadership roles. The graph below illustrates in a very straightforward way the challenges and opportunities when it comes to genders and seniority. It is evident that women are more dominant in junior roles, while men continue to dominate the more senior roles. We believe a better balanced and more uniform distribution across levels will serve everyone's best interests.
Benefits
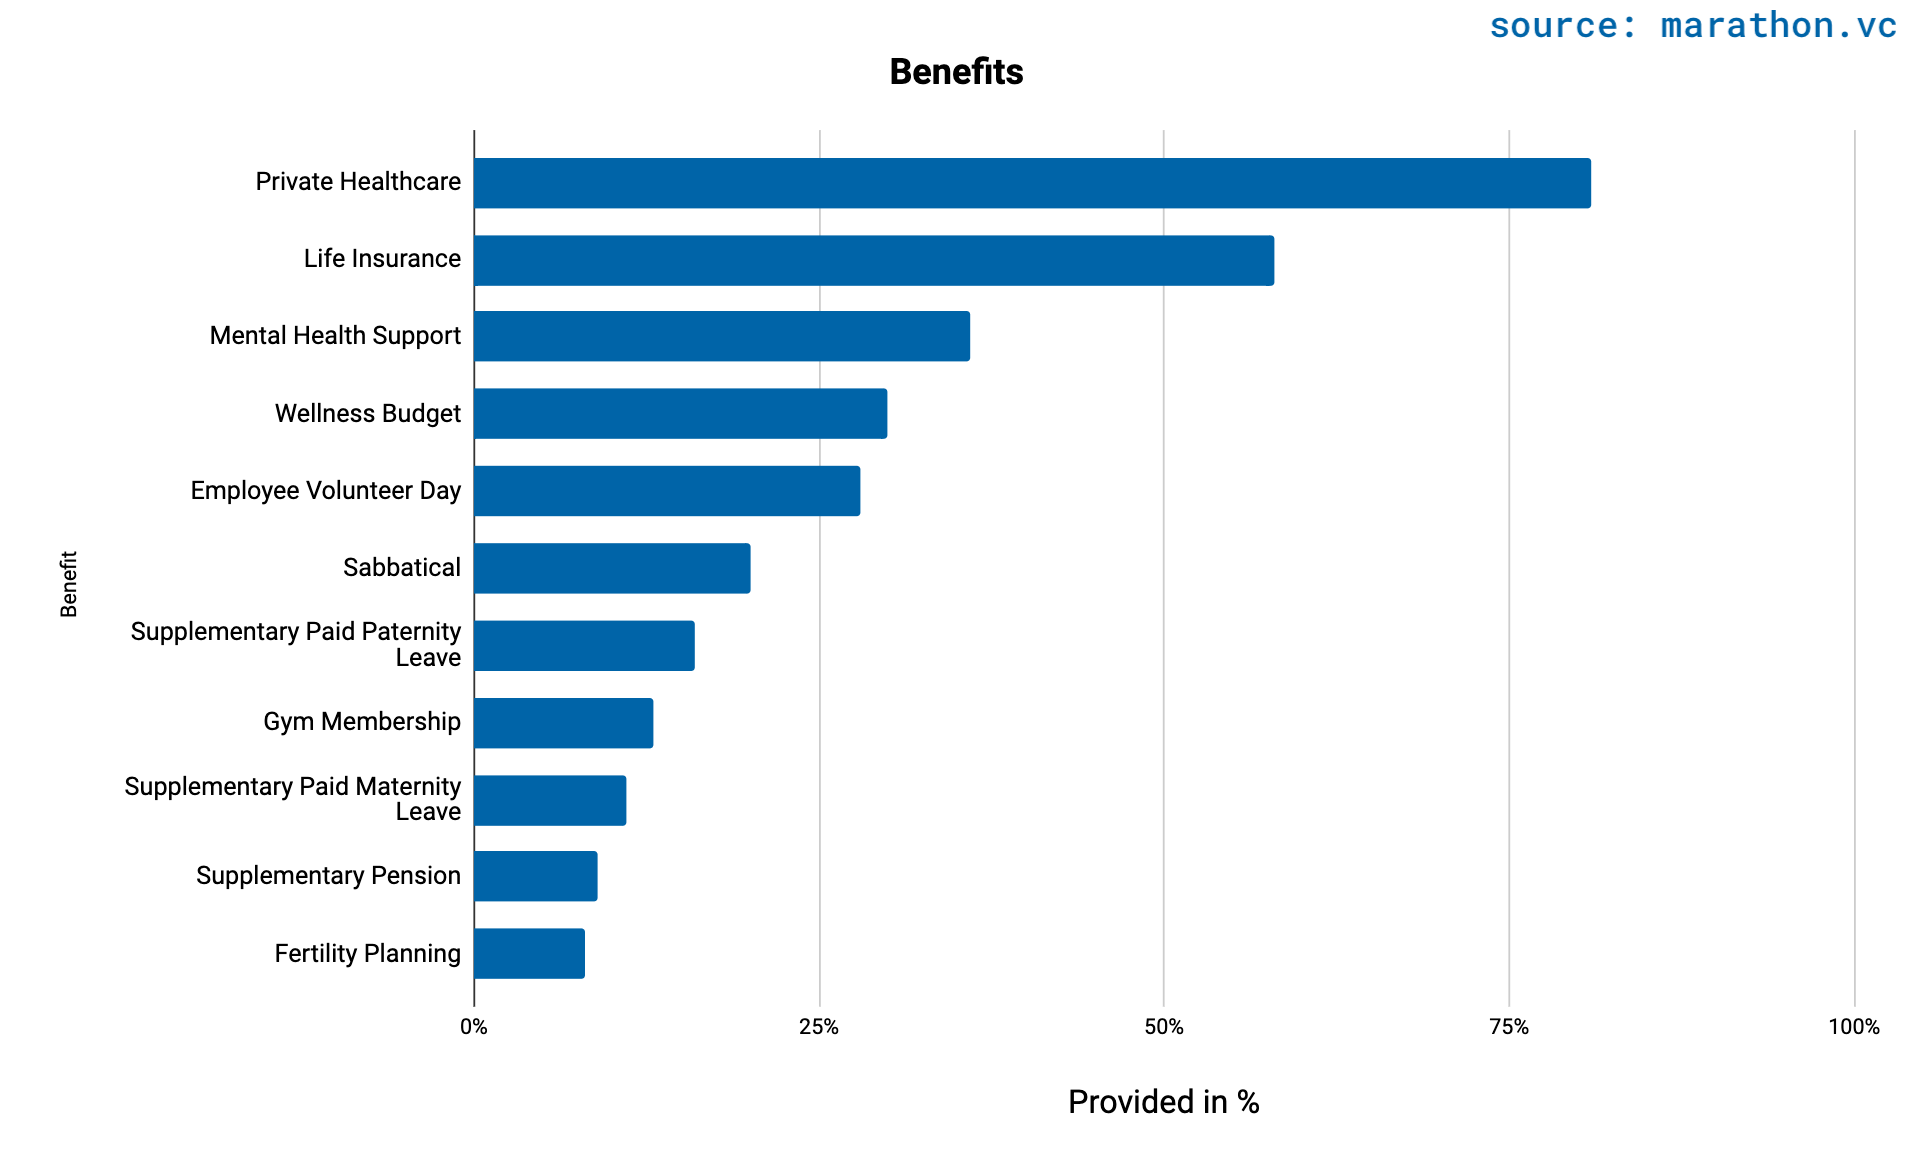
Below is an overview of the % of companies that provide each of these benefits. From this overview, we can see, for example, that 81% of companies offer their employees private health insurance, and 30% of companies provide a wellness budget. Interestingly, we see over a third (36%) provide mental health support for their employees, a benefit that, since COVID-19, has seen a strong increase globally.
We also made an effort to study the various benefits that Greek startups are providing to their employee base. Below you may find the percentage of companies that provide each benefit listed.
It is important to highlight that most startups provide private healthcare and life insurance benefits. At the same time, we increasingly see benefits such as a wellness budget (30%), mental health support (36%), and sabbaticals (20%) being part of the benefits package.
In Conclusion
Through our extensive research with numerous tech startups, we have found that, overall, tech companies face similar questions and challenges regarding compensation. We believe that knowledge is power, and therefore, transparency and knowledge sharing are essential factors in helping employees and companies grow and succeed.
The tech companies participating in this report are part of a change to help create more transparency in the Greek startup ecosystem. It authenticates that tech companies are increasingly looking at how they can hire, attract and retain the best talent for their teams. If you are curious about what tech companies are hiring? Check the Greek Startup Pirate’s job board for the most recent open roles.
We hope the information provided will prove to be a valuable resource in helping founders and operators build revolutionary startups, as well as attract and empower a fast-growing and diverse workforce in building a successful career in tech companies.
If you are a tech company and interested in participating in the next Greek Compensation Report, please feel free to fill out this form or send an email to sanne@marathon.vc for more information. We look forward to next year!